Key takeaway: When a RAG system gets worse in production, "check the logs" fails you, because a wrong answer isn't a crash — it's a plausible sentence with no stack trace. Observability for RAG means capturing every request as one distributed trace (embed → retrieve → rerank → generate), attaching the signals that reveal quality (retrieval hit rate, context relevance, faithfulness, latency, cost), and running online evals that read meaning, not just uptime. The decision this post helps you make: stop debugging RAG by re-reading answers and start instrumenting it, so "it got worse this week" becomes "the reranker started dropping the authoritative chunk on multi-hop queries at 14:00 Tuesday" — a specific span, not a shrug.
If you run RAG in production, you have lived this: answer quality quietly degrades, support tickets tick up, and your dashboards are all green. CPU is fine, latency is fine, the 500 rate is zero — and the product is worse. Nothing is "down," so nothing alerts. You re-read a few transcripts, form a theory, and change something. That is not debugging; that is guessing with extra steps.
So the "so what" is a shift in what you instrument: a RAG failure is a quality event, not an availability event, and your standard APM stack was built to catch the wrong kind. A model that confidently cites the wrong document returns HTTP 200. The only way to see that failure is to trace each request through its retrieval and generation stages, record what was actually fetched and generated, and score it — continuously, in production. This post is the blueprint: the three signals that make RAG legible, how to instrument the request as one trace, and the online evals that catch a regression before your users narrate it back to you.
Previous post: RAG Evaluation: Prove a Retrieval Change Actually Helped.
What this post covers
By the end, you should be able to take a "the AI feels worse lately" complaint and localize it to a specific stage, query pattern, and time window — with a trace and a metric, not an anecdote.
- Why "check the logs" fails for RAG — a wrong answer is a silent success to every conventional monitor.
- Observability is three signals, not one dashboard — traces, metrics, and evals, each answering a different question.
- Instrument the request as one trace — the embed → retrieve → rerank → generate span tree, and the OpenTelemetry GenAI conventions that standardize it.
- The metrics that catch a regression before users do — retrieval hit rate, context relevance, faithfulness, latency, and cost per answer.
- Online evals: the guardrail that reads meaning — scoring live traffic for groundedness, not just watching for 500s.
- A RAG observability readiness scorecard — a worksheet to grade your current setup.
- Where Inherent fits — why a trace is only debuggable if the retrieval it records is replayable.
Why "check the logs" fails for RAG
Start with the answer, because it explains why your existing tooling goes quiet exactly when you need it: a RAG failure produces a successful-looking response, so every signal your APM stack watches stays green while quality falls. Traditional observability was built for services that fail loudly — an exception, a timeout, a 5xx. RAG fails softly.
Concretely, three properties of RAG defeat conventional monitoring. First, the failure mode is semantic, not structural. A hallucinated citation, a stale answer, a confident "yes" that should have been "the corpus doesn't say" — all of these are well-formed HTTP 200s. There is no error to count. Second, the pipeline is multi-stage and the blame is ambiguous. A single answer passed through an embedding call, a vector search, maybe a reranker, a context assembly step, and a generation call. When the output is wrong, an aggregate latency chart can't tell you which stage regressed — and the stages have opposite fixes. Third, the input space is unbounded and drifting. Users ask new things, the corpus changes under you, and a config that was fine last week meets a query pattern it was never tested on. A frozen offline eval (the subject of the previous post) proves a change is safe before ship; it cannot see what live traffic does after.
The implication: you cannot monitor a RAG system the way you monitor a checkout service. You need to record the content of each stage — what was retrieved, what was generated, whether it was grounded — and score that content, not just time it. That is the whole job of RAG observability, and the rest of this post builds it stage by stage.
Observability is three signals, not one dashboard
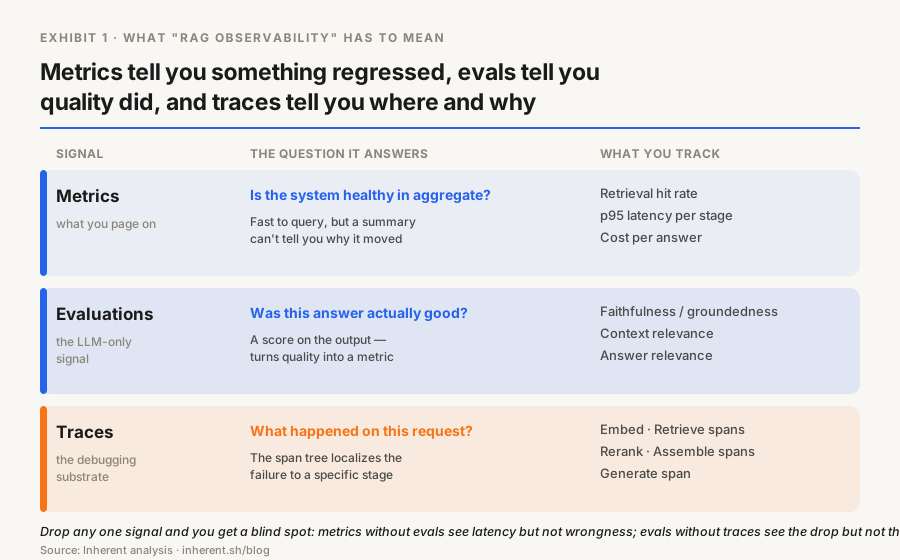
Here's the answer first: RAG observability rests on three distinct signals — traces, metrics, and evaluations — and each answers a question the other two can't. Teams that "have observability" but still can't debug usually have one of the three (metrics), mistake it for all three, and are blind to the other two.
Traces answer what happened on this request? A trace is the end-to-end record of one user query as it moves through every stage, with each stage captured as a timed, attributed span. Traces are how you go from "answer #48213 was wrong" to "because retrieval returned these five chunks, and none held the answer." They are the debugging substrate — the closest thing RAG has to a stack trace.
Metrics answer is the system healthy right now, in aggregate? These are the numeric time series you alert on: retrieval hit rate, p95 latency, cost per answer, tokens per request. Metrics are cheap to store and fast to query, so they carry your dashboards and pages — but a metric is a summary, and a summary can't tell you why it moved.
Evaluations answer was this answer actually good? This is the signal unique to LLM systems and absent from classic observability: a score — faithfulness, context relevance, answer relevance — attached to individual responses, computed by a model judge or a heuristic. Evals turn "the output" into "a number you can trend and alert on," which is what makes quality a monitorable property instead of a vibe.
The three compose into a loop: metrics tell you something regressed, evals tell you quality regressed and by how much, and traces tell you where and why. Miss one and you have a blind spot — metrics without evals see latency but not wrongness; evals without traces see that quality dropped but not which stage caused it. The exhibit below is the whole model on one page.
Instrument the request as one trace
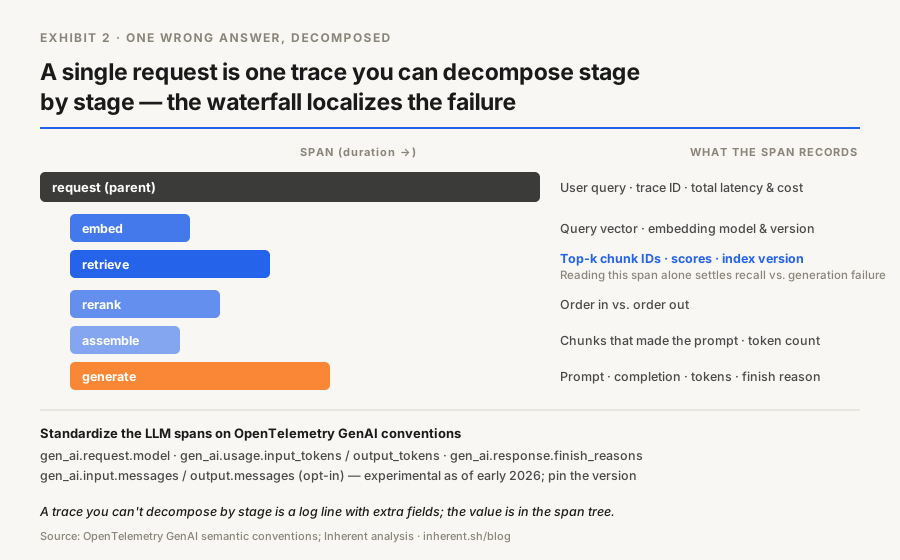
The answer first: capture every RAG request as a single distributed trace whose spans mirror the pipeline stages — embed, retrieve, rerank, assemble, generate — each recording its inputs, outputs, and cost. A trace you can't decompose by stage is a log line with extra fields; the value is in the span tree.
A well-instrumented RAG request produces a span waterfall. The parent span is the request. Under it: an embedding span (the query vector, the model, the latency), a retrieval span (the query, the top-k chunk IDs and their scores, the corpus/index version), often a rerank span (what came in, what came out, in which order), a context assembly span (which chunks made the final prompt, total token count), and a generation span (the assembled prompt, the completion, token usage, finish reason). Each span carries the payload for its stage, so when the answer is wrong you can read exactly what each stage saw and produced — the retrieval span alone usually settles whether this was a recall failure or a generation failure.
You don't have to invent the schema. OpenTelemetry now defines GenAI semantic conventions — a standard gen_ai.* attribute namespace for LLM spans, covering gen_ai.request.model, gen_ai.usage.input_tokens / gen_ai.usage.output_tokens, gen_ai.response.finish_reasons, the provider, and opt-in capture of gen_ai.input.messages / gen_ai.output.messages (OpenTelemetry GenAI span spec; OTel GenAI observability overview). Most of these are still experimental as of early 2026, so pin your convention version and expect churn — but instrumenting to the standard means your traces are portable across backends instead of welded to one vendor. The RAG-specific stages (retrieval, rerank) sit under the same trace as custom spans, so the whole request reads as one tree.
The business-life version: think of a trace as the itemized receipt for one answer. A summary metric tells you "spend is up 12% this week"; the receipt tells you "this specific purchase was the reranker call that ran twice and still dropped the right chunk." You cannot dispute a charge you can't itemize, and you cannot fix a regression you can't trace to a stage.
The metrics that catch a regression before users do
Here's the answer: a small set of RAG-specific metrics, trended over time and alerted on, will surface most regressions before your users do — but only if they include quality proxies, not just infrastructure numbers. Latency and error rate are necessary and radically insufficient; add the signals that move when answers get worse.
The metrics worth putting on the wall, in two groups. The system-health group is familiar: p50/p95 latency per stage (a slow reranker shows up here), cost per answer and tokens per request (a prompt-assembly bug that stuffs the context window shows up as a cost spike, not an error), and throughput / error rate for the boring failures that still happen. The answer-quality group is the one most teams are missing: retrieval hit rate (how often the known-relevant chunk appears in top-k on traffic where you can infer relevance), context relevance (what fraction of retrieved context is actually on-topic — falling relevance is an early warning that an index or embedding change went sideways), faithfulness / groundedness rate (the share of answers fully supported by retrieved context, your live hallucination gauge), and citation coverage (are load-bearing claims traceable to a source). These quality signals come from the online evals in the next section; a metric like "faithfulness rate" is just an eval score aggregated into a time series you can alert on.
The discipline that makes metrics useful is segmentation. A global faithfulness average of 0.9 can hide a collapse to 0.6 on multi-hop questions or on documents updated in the last 24 hours — precisely the queries that matter most. Slice every quality metric by query type, corpus segment, and tenant, and alert on the slice, not just the aggregate. Most "it silently got worse" stories are a healthy average masking a sick segment.
Online evals: the guardrail that reads meaning
The answer first: run automated evaluations on live traffic — not just on your frozen offline set — so quality is a monitored signal with alerts, the same way latency is. Offline eval, covered in the previous post, decides whether to ship. Online eval decides whether reality agrees once real users and a drifting corpus hit the system. Both are necessary; neither replaces the other.
Mechanically, an online eval scores a sample of production responses on the same grounding dimensions you gate on offline — faithfulness, context relevance, answer relevance — using an LLM-as-a-judge or cheaper heuristics, and emits the scores as metrics on the trace. Modern LLM observability platforms are built around exactly this trace-plus-eval pattern: capture the spans, attach evaluation scores, alert on regressions (Arize Phoenix LLM tracing and evaluation; Langfuse vs Phoenix comparison; survey of LLM observability tooling). Three rules keep online eval honest, and two of them carry straight over from offline practice:
- Sample, don't score everything. Judging every production call is expensive and usually unnecessary. Score a representative sample, and oversample the segments you worry about (new corpus, multi-hop, high-value tenants).
- De-bias the judge. The same judge biases that corrupt offline eval — position, verbosity, self-preference — corrupt online eval. Prefer pointwise grounding checks ("is claim X supported by the retrieved context — yes/no, quote it") over holistic taste, and calibrate against a small human-labeled slice.
- Alert on the derivative, not just the level. A faithfulness rate of 0.85 might be your normal. What you page on is the drop — a statistically meaningful decline versus the trailing baseline for that segment — because that's the shape of a real regression.
The honest caveat that connects everything: an online eval is only as trustworthy as the trace it scores, and a trace is only debuggable if you can reproduce what it recorded. If retrieval is non-deterministic — the index rebuilt, an embedding model version drifted, tie-breaks resolved differently — then the trace you're debugging shows a retrieval decision the system may never make again, and the eval score is graded against a moving target. Reproducibility is the precondition that makes the whole loop mean something.
A RAG observability readiness scorecard
Grade your current setup against this. Each row is a capability; a system that can't clear a row has a specific, nameable blind spot — not a vague "we need better monitoring."
| Capability |
The question |
You're ready if |
If not |
| End-to-end trace |
Can you pull up one request as a span tree? |
Every stage (embed → retrieve → rerank → generate) is its own span with inputs/outputs |
You're reading log lines; you can't localize failures |
| Retrieval visibility |
Does the trace record which chunks were fetched and their scores? |
Chunk IDs, scores, and index version are on the retrieval span |
You can't tell recall failures from generation failures |
| Standard schema |
Are LLM spans on OpenTelemetry GenAI conventions? |
gen_ai.* attributes, pinned convention version |
Traces are vendor-locked and brittle to migrate |
| Quality metrics |
Do you trend faithfulness / context relevance, not just latency? |
Quality scores are time series with alerts |
Green dashboards, worse product — the silent regression |
| Segmentation |
Can you slice quality by query type, corpus, tenant? |
Alerts fire on the sick slice, not the healthy average |
A collapsing segment hides behind a global mean |
| Online eval |
Is live traffic scored for groundedness, not just uptime? |
Sampled responses judged and alerted on drop |
You learn about regressions from support tickets |
| Reproducibility |
Can you replay the exact retrieval a trace recorded? |
Pinned corpus version + deterministic retrieval |
Your trace shows a decision the system won't repeat |
The pattern the scorecard exposes: the first six rows are worthless if the last one fails. You can build a beautiful trace-and-eval stack, and if the retrieval it records isn't reproducible, every investigation ends at "well, it wouldn't do that again" — which is not a fix, it's a dismissal.
Where Inherent fits
Only now, with the observability stack built, does the product framing earn its place. Look at the bottom row of the scorecard — Reproducibility — because it's load-bearing for every row above it. A trace is a debugging tool only if you can act on what it shows, and you can only act on a retrieval decision you can reproduce. The moment retrieval is non-deterministic, your beautifully instrumented trace records a one-time event: the index rebuilt overnight, a document re-embedded under a new model version, tie-breaks resolved differently, and the "cause" your trace points to is a decision the system may never make again.
That reproducibility is exactly what a managed context layer supplies, and it's what Inherent is — it sits above your vector storage and below your orchestration. The truth layer version-stamps and hashes each source at ingestion, so a trace can record not just "these chunks" but "these chunks, from this pinned corpus version" — a replayable fact instead of whatever the index held that afternoon. The memory layer makes retrieval deterministic and tenant-safe: the same query over the same corpus version returns the same chunks, so when you re-run a traced request to investigate, you see what actually happened, not a fresh roll of the dice. The audit layer issues a retrieval receipt — which sources, versions, and chunks produced the context — which is, functionally, the retrieval span you wish every trace had, guaranteed rather than best-effort. Observability tells you a regression happened; reproducible retrieval is what lets you chase it to ground.
To be clear about where we are: Inherent is early, and this is an architecture argument, not a benchmark claim. If your retrieval is already fully pinned and reproducible, your traces are already debuggable and this is just confirmation. But if you've ever closed a RAG incident with "couldn't reproduce," that's the tell — the gap isn't your dashboards, it's the determinism underneath them.
The bottom line, and where to start
RAG fails silently: a wrong answer is a successful response to every monitor built for availability. Making it legible takes three signals — traces to see what happened on a request, metrics to see health in aggregate, evals to see whether the answer was actually good — instrumented to a standard schema and scored on live traffic. And all of it rests on one precondition: a trace is only debuggable if the retrieval it records can be reproduced.
Small task for today: pick one recent "the AI got worse" complaint you never fully explained. Pull the requests from that window, and check whether you can reconstruct, for a single bad answer, exactly which chunks retrieval returned and in what order. If you can't, you just found your first blind spot — start there. Then close the reproducibility gap so the next investigation ends in a fix instead of a shrug: start with the Inherent Public API — get started in the docs. Building this observability loop yourself and hitting the "couldn't reproduce the retrieval" wall? DM Flow on X with where it breaks — that determinism gap is exactly what we're building against.
Next read: Production RAG Needs Truth and Memory.